Checking and viewing error logs in CyberPanel is essential for diagnosing issues with your websites and server. CyberPanel provides easy access to various logs, including error logs. Here’s how you can check error logs on CyberPanel:
Steps to Check Error Logs on CyberPanel
1. Log in to CyberPanel
- Open your web browser and go to https://<your-server-IP>:8090.
- Log in using your CyberPanel credentials.
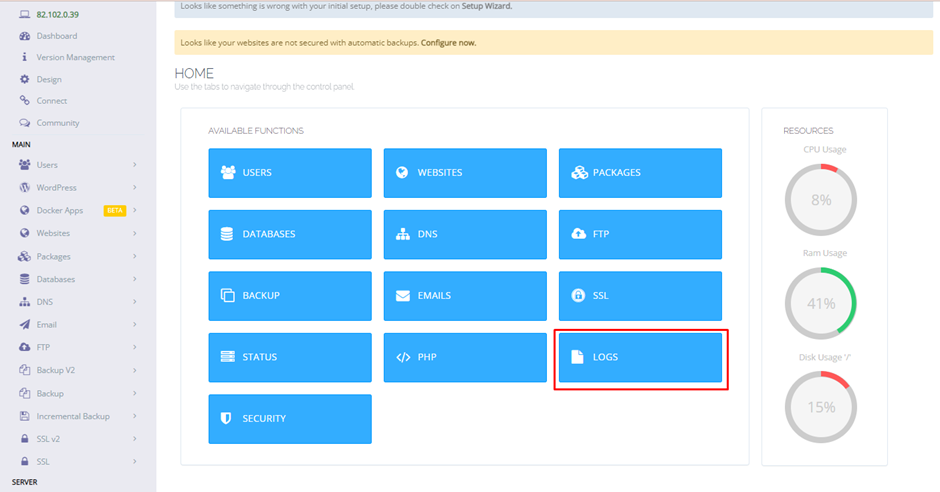
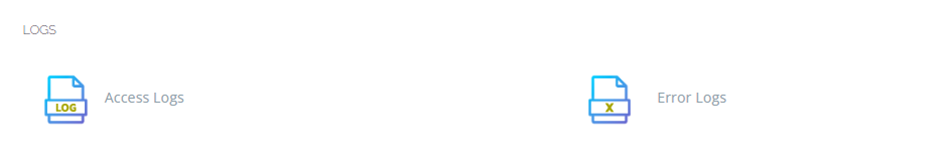
2. Access the Logs Section
From the CyberPanel dashboard, navigate to Logs.
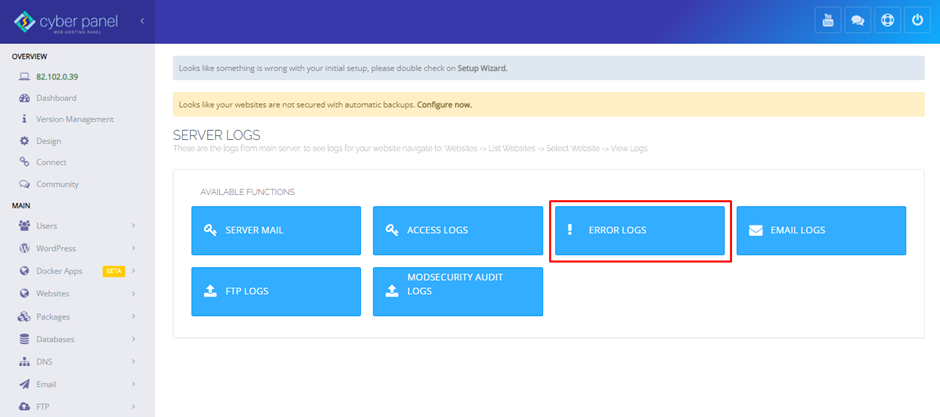
3. Select Error Logs
- In the Logs section, you will find different types of logs available.
- Click on “Error Logs” to view the logs related to errors.
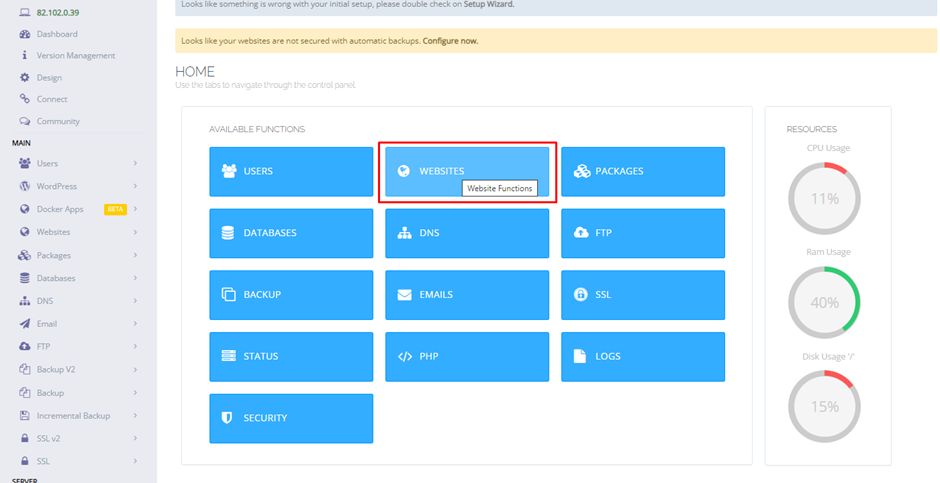
4. Select Website
If you want to view error logs for a specific website, you can select the website from the dropdown menu or list provided.
5. View Logs
The error logs will be displayed on the screen. You can scroll through the logs to identify any issues.
Logs typically include error messages, timestamps, and other relevant information that can help diagnose problems.